
Quantitative and qualitative element-analysis of implant-surfaces by SEM and EDX
PRELIMINARY STUDY REPORT
1 Background and Aim
Implant surfaces are modified by microstructures and surface extension to improve osseointegration. Numerous studies showed an increased adhesion and osteoblastic matrix-production on retentive titanium surfaces.
In 2008 the University of Cologne, Germany and the BDIZ EDI (European Association of Dental Implantology) with its Quality and Research (Q&R) Committee (www.bdizedi.org) performed a scanning electron microscopic study and analyzed the surfaces of 23 enossal titanium implants of several manufacturers at the Interdisciplinary Policlinic for Oral Surgery and Implantology, Department for Craniomaxillofacial and Plastic Surgery, University Cologne1. The tested implants showed isolated and/or extensive deposits. Depending on manufacturing process, accumulations of organic material (carbon) or inorganic material like aluminum, silicon, phosphor, sulfur, chlorine, potassium and calcium were found.
In 2011-2012 we performed the same protocol on 57 dental implants from different manufacturers. However, the manufacturing of implants requires an adequate system of quality controls. Although some manufacturers have made substantial improvements since our first survey in 2008, the study in 2011-2012 again singled out a few implants with larger areas of surface blasting residue and selective organic impurities2.
The BDIZ EDI3, representing more than 5,500 active implantologists in Europe, was asked in its general meeting to continue these analyses periodically and to publish the results in the European EDI Journal.
While using the same material an methods regarding the technical setup this study allows comparisons to the results of previous studies.
As a continuance of the two studies cited above the aim of this study is to verify improvements of manufacturing and quality management as well as to demonstrate the high quality level of the participating manufacturers and implant companies.
2 Material and Method / Study Protocol
2.1 Scientific Workstation and Test Procedure
The scientific workstation is a Phenom proX Scanning Electron Microscope, equipped with a high-sensitivity backscattered electron detector that allows compo- sitional and topographical imaging modes. EDX analyses are performed with a thermoelectrically cooled Silicon Drift Detector (SDD).
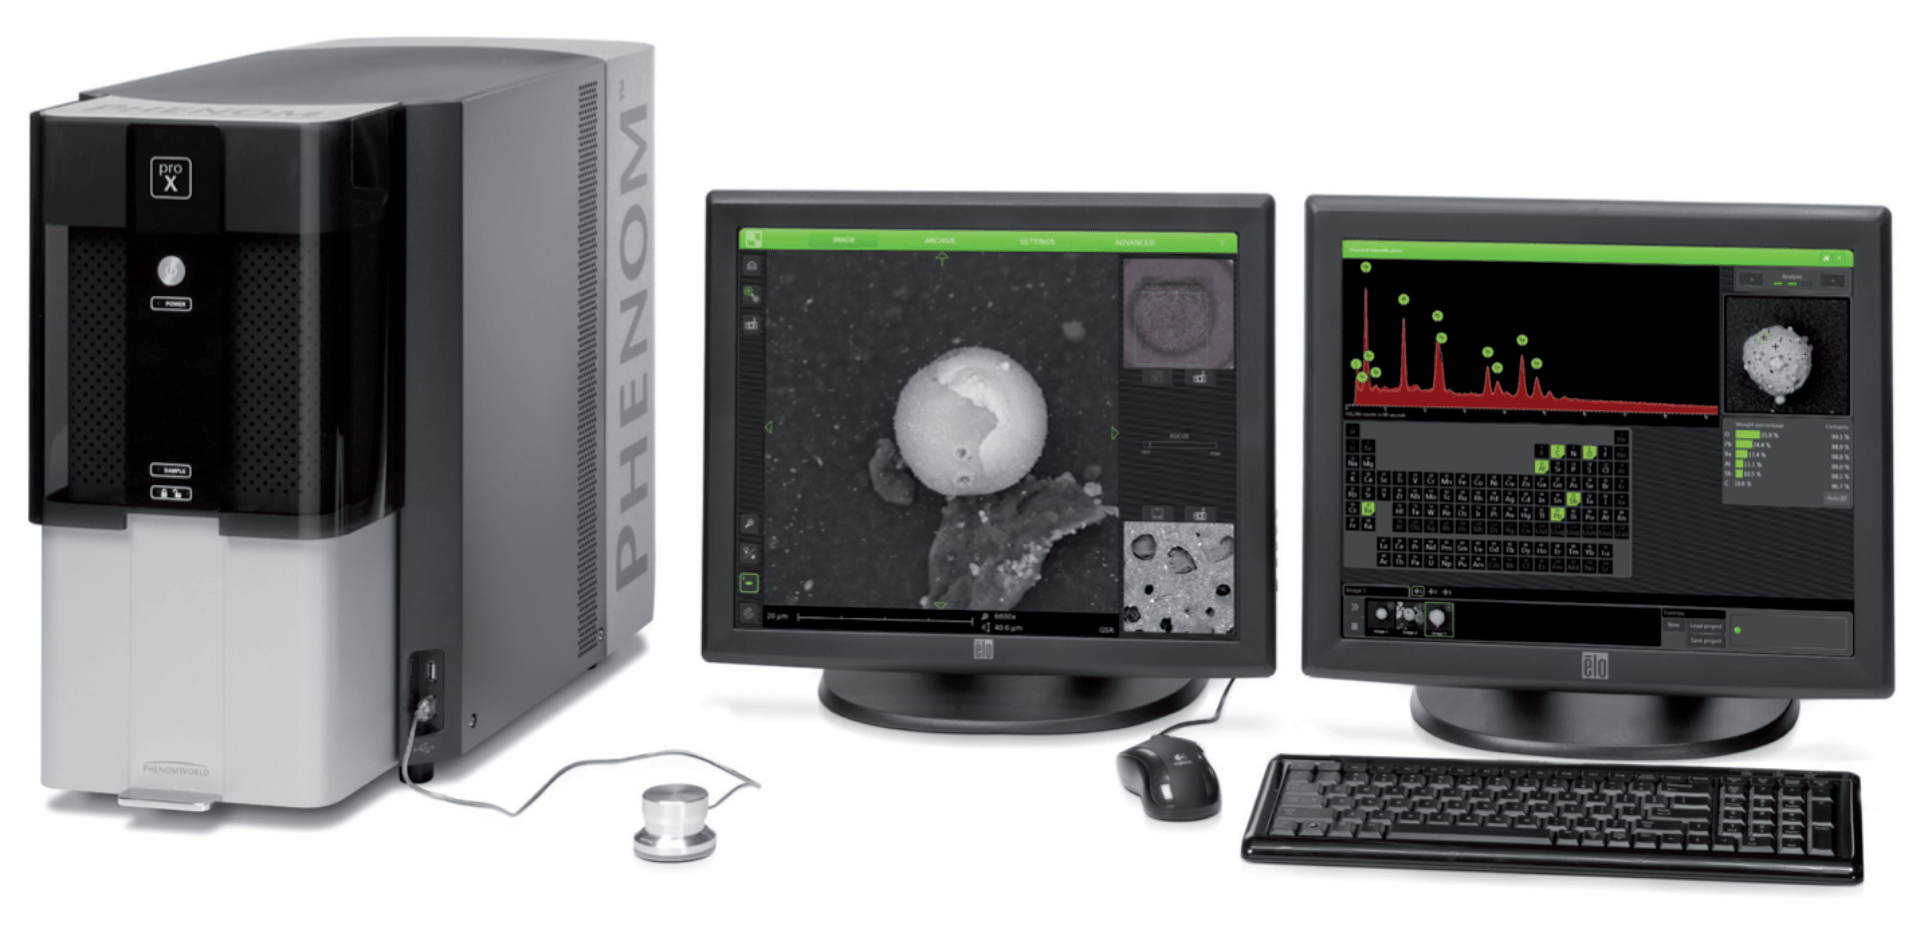
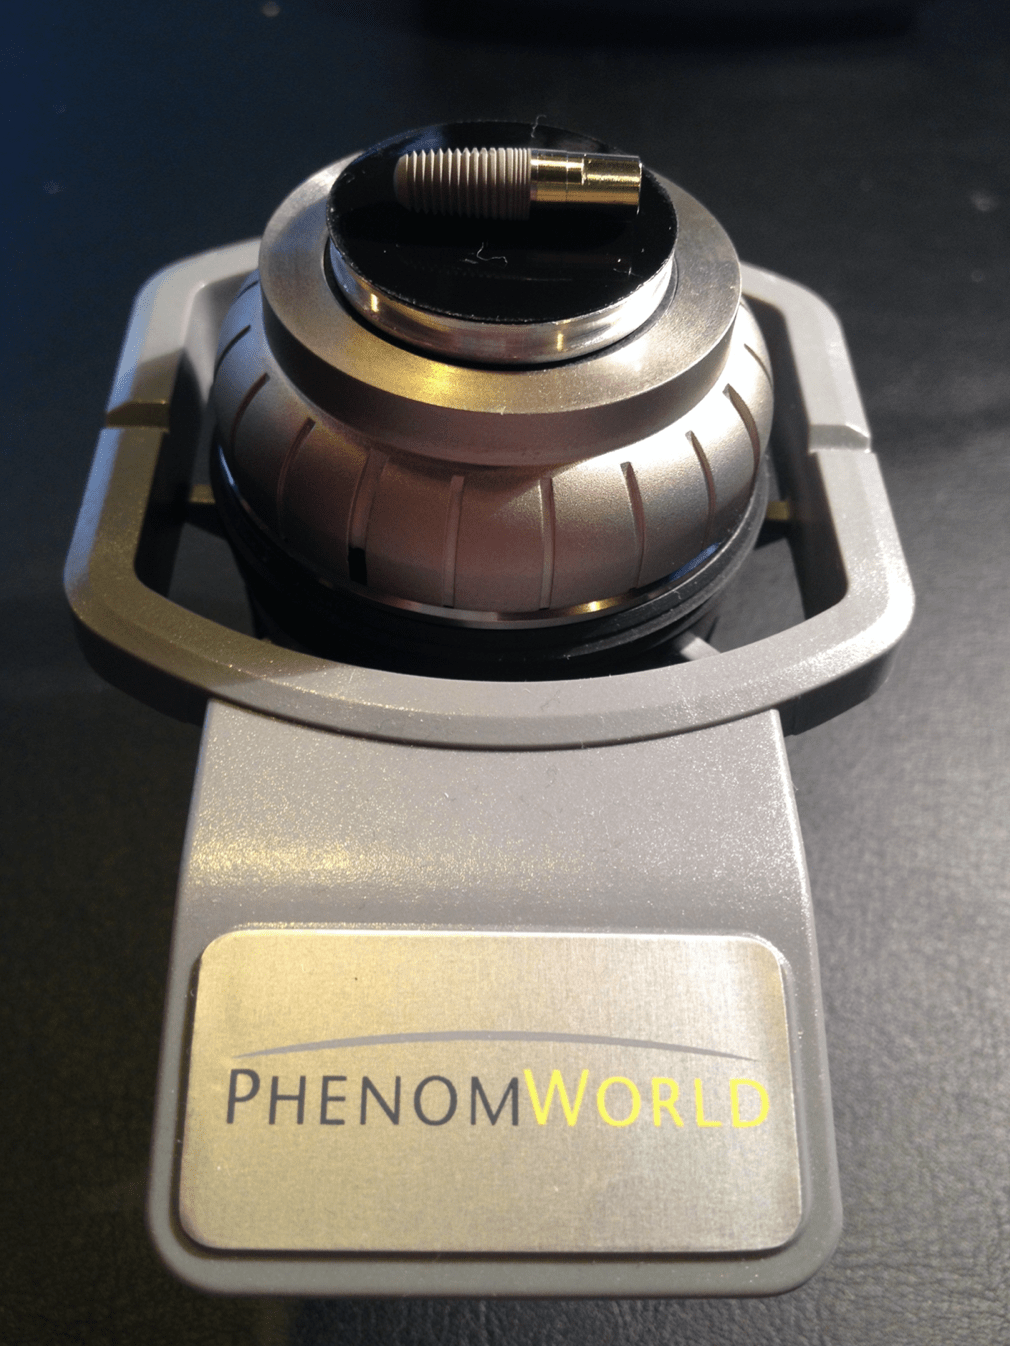
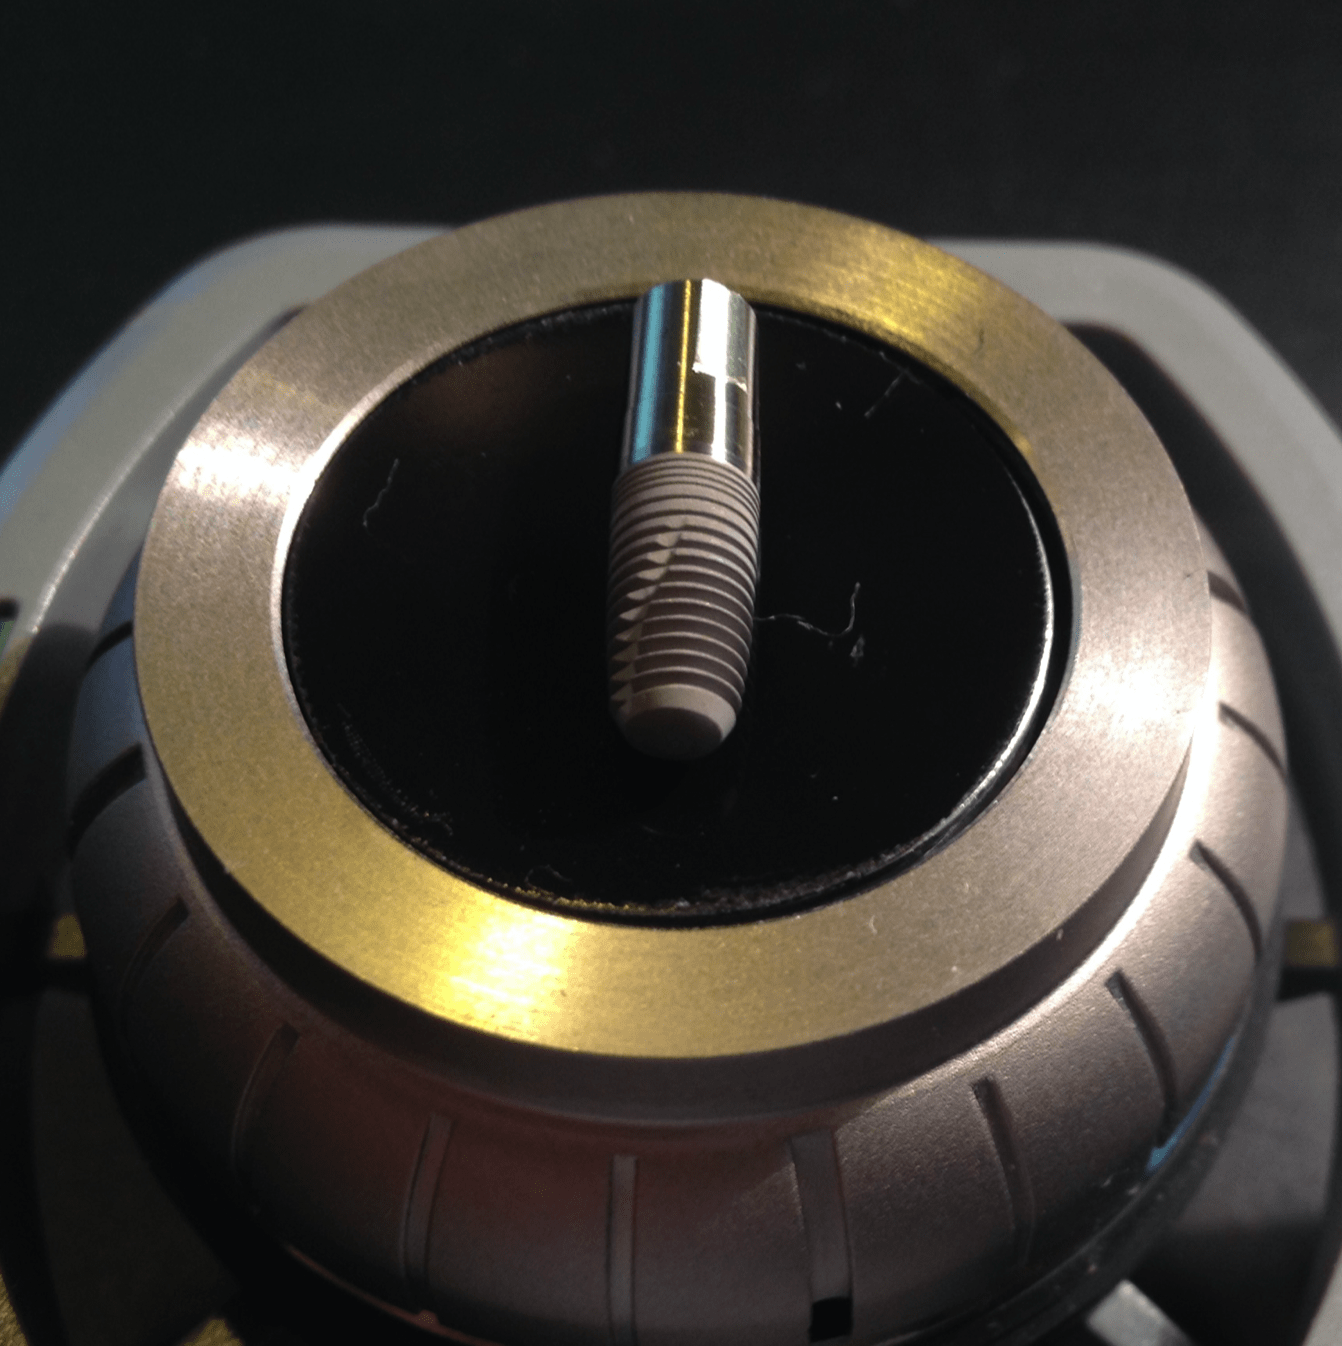
Without touching the surface, each implant will be taken out of the package with sterile forceps and will be fixed on the sample holders. After the vacuum is generated in the electron microscope imaging and EDX-analyses will be completed.
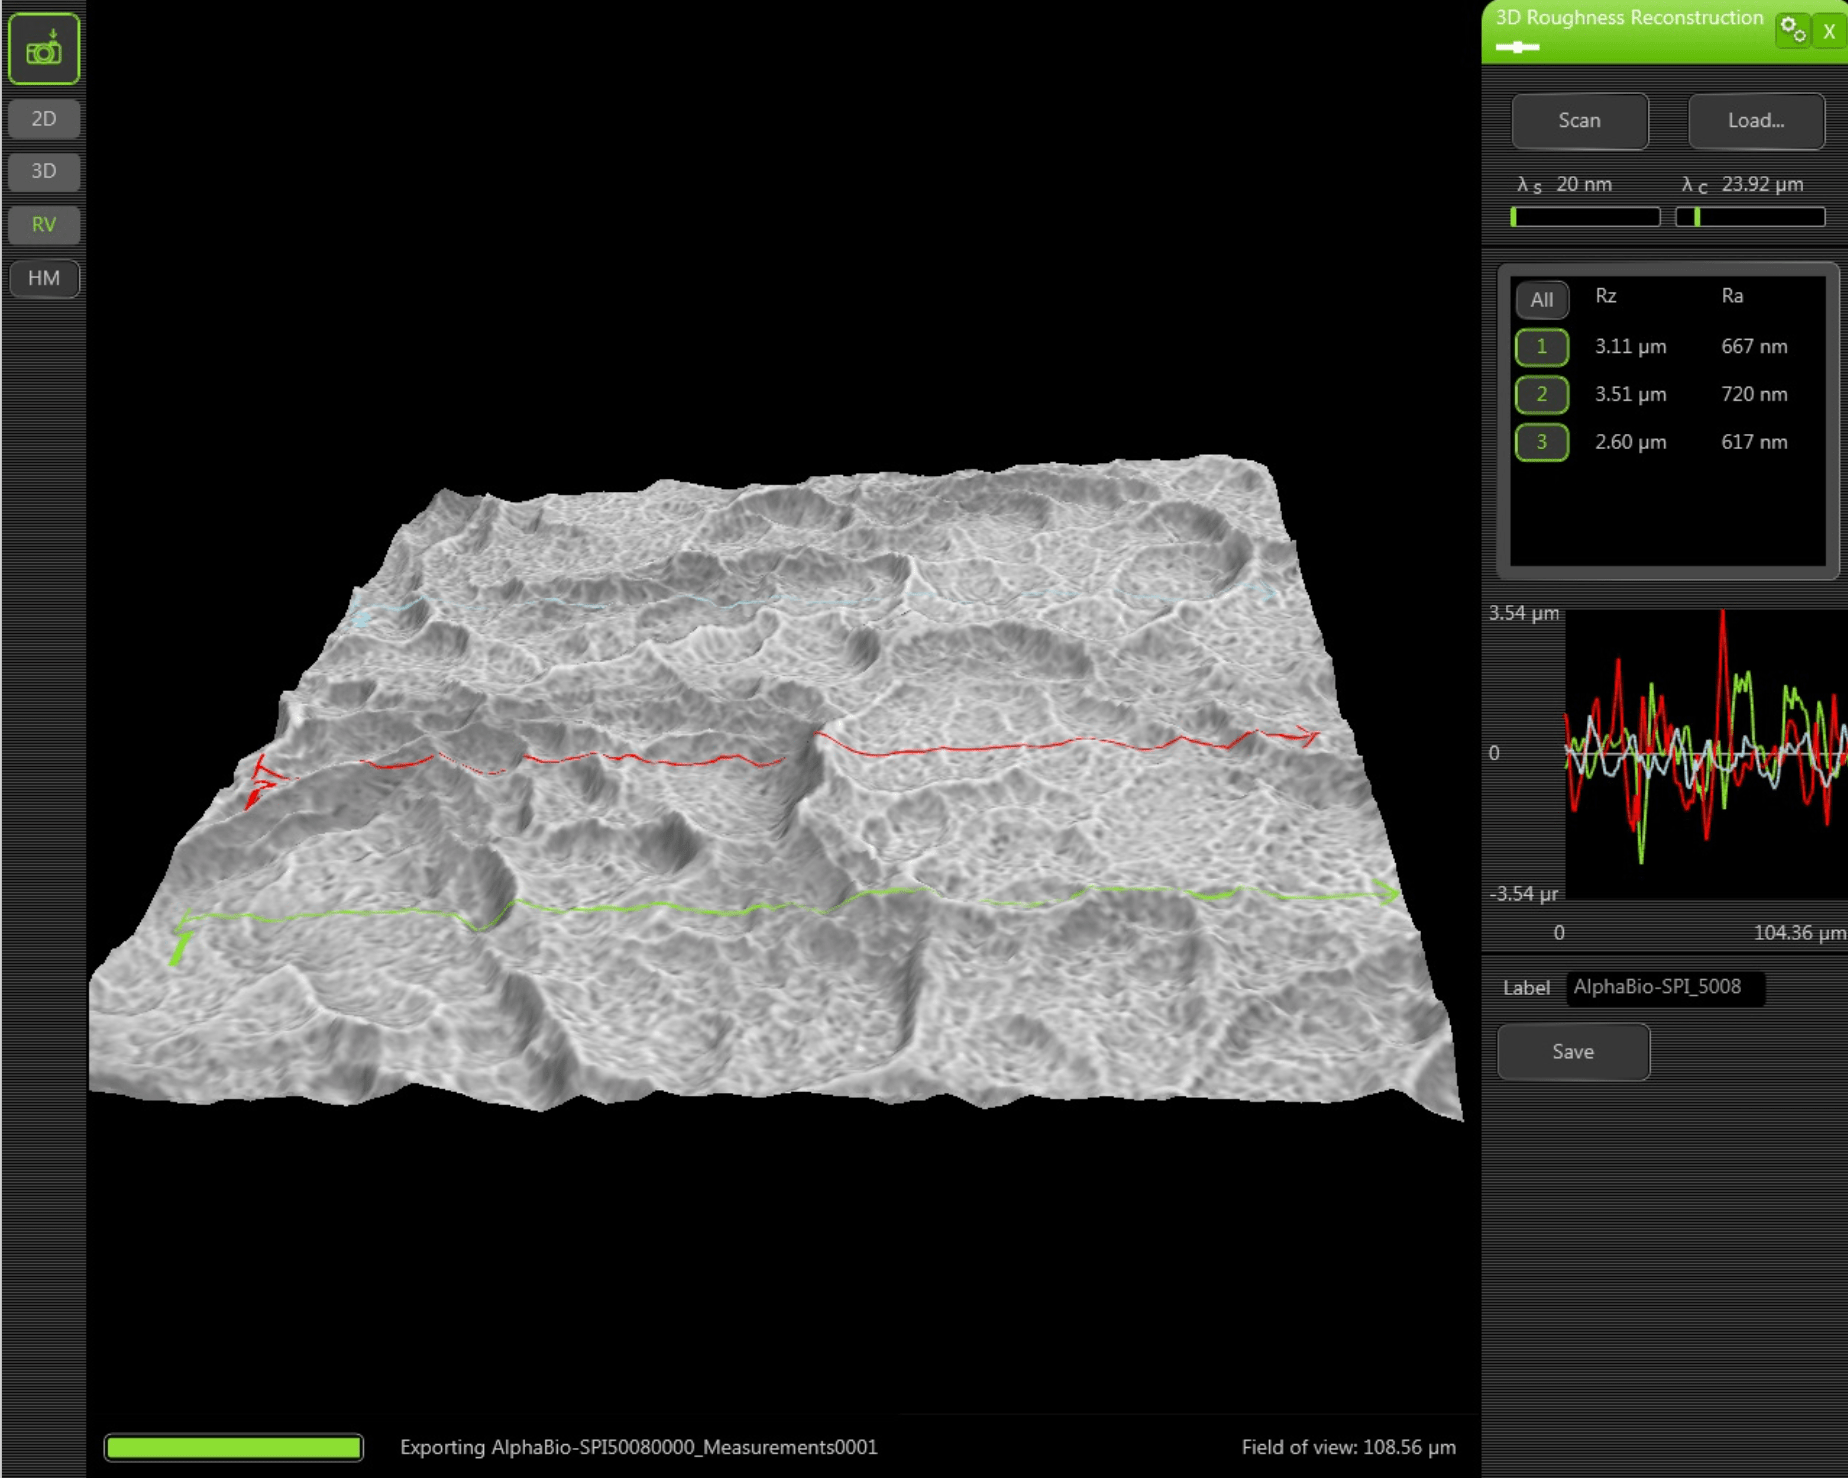
2.2 3D Roughness Reconstruction
With a specific 3D roughness reconstruction application, based on a „shape from shading” technology, the SEM system used in this study is able to generate three- dimensional images and submicrometer roughness measurements.
3D imaging helps to interpret sample characteristics and makes images under- standable. In addition the system is able to measure the average roughness (Ra) and the roughness height (Rz). Due to shape-from-shading technology Ra and Rz data in this study are to be generally understood merely as approximate values.
2.3 SEM-Examination of Implant Surface
Scanning electron microscopy (SEM) enables the topical evaluation of the implant surface. In particular at low voltages and small working distances, images with high contrast can be obtained. The high-sensitivity backscattered electron detector is generating images in compositional and topographical modes to a magnification of 20.000x.
Besides information about morphology and surface topography, the BSE detector allows to draw conclusions about the chemical nature and allocation of different remnants or contaminations on the sample material.
2.4 Qualitative and Quantitative Analysis of Implant Surfaces(EDX)
Energy Dispersive X-ray Spectroscopy (EDX) analyzes X-rays generated by the electrons of the electron beam (CeB6 electron source) while they are interacting with the sample. Each element emits specific X-ray peaks. The element identification software allows to identify even hidden elements within the sample via the spot mode analysis. All results are verified using iterative peak stripping deconvolution. An area-analysis and one or more spot analyses are performed for each tested implant (analysis of spots and areas by EDX). An area-analysis covers the entire implant area in the focus of the microscope. For a spot analysis, the electron beam is focused on a specific area to get information about selective accumulations on the implant surface.
If necessary, elemental mapping reveals the distribution of elements within the sample. Selected elements can be mapped. Compiling these elements with the backscattered image gives a clear insight into the distribution of elements within the sample. Line scan allows analysis to be performed over a selected line. A line profile of every selected element is displayed on the screen.5
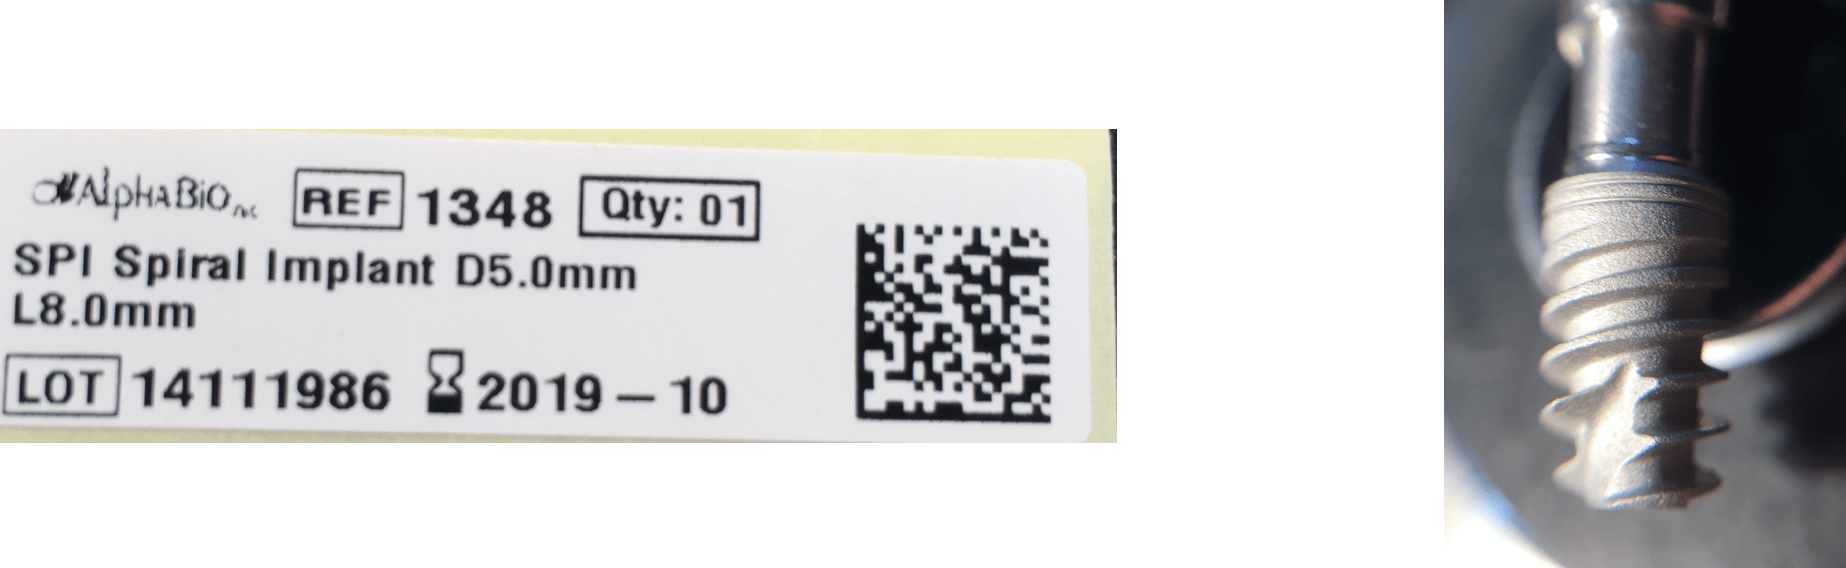
3 Alpha-Bio Tec - SPI Spiral Implant LOT 14111986
3.1 3D Roughness Reconstruction
3.2 Surface-Topography - Material Contrast Images (Thread)
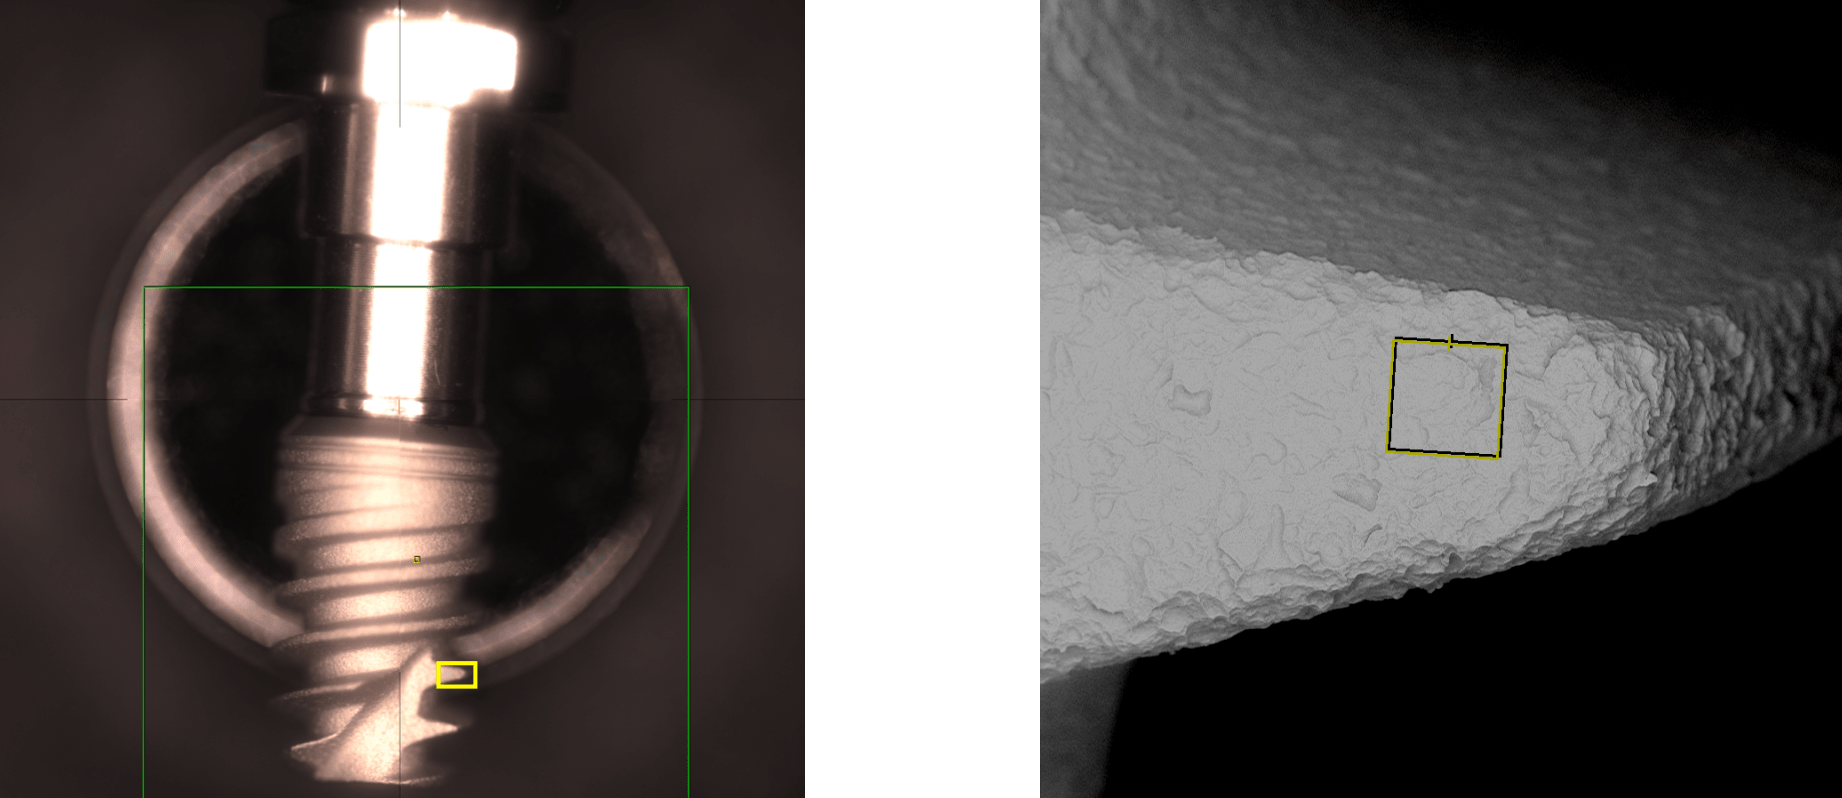
Surface-Topography - Material Contrast Images (Thread)
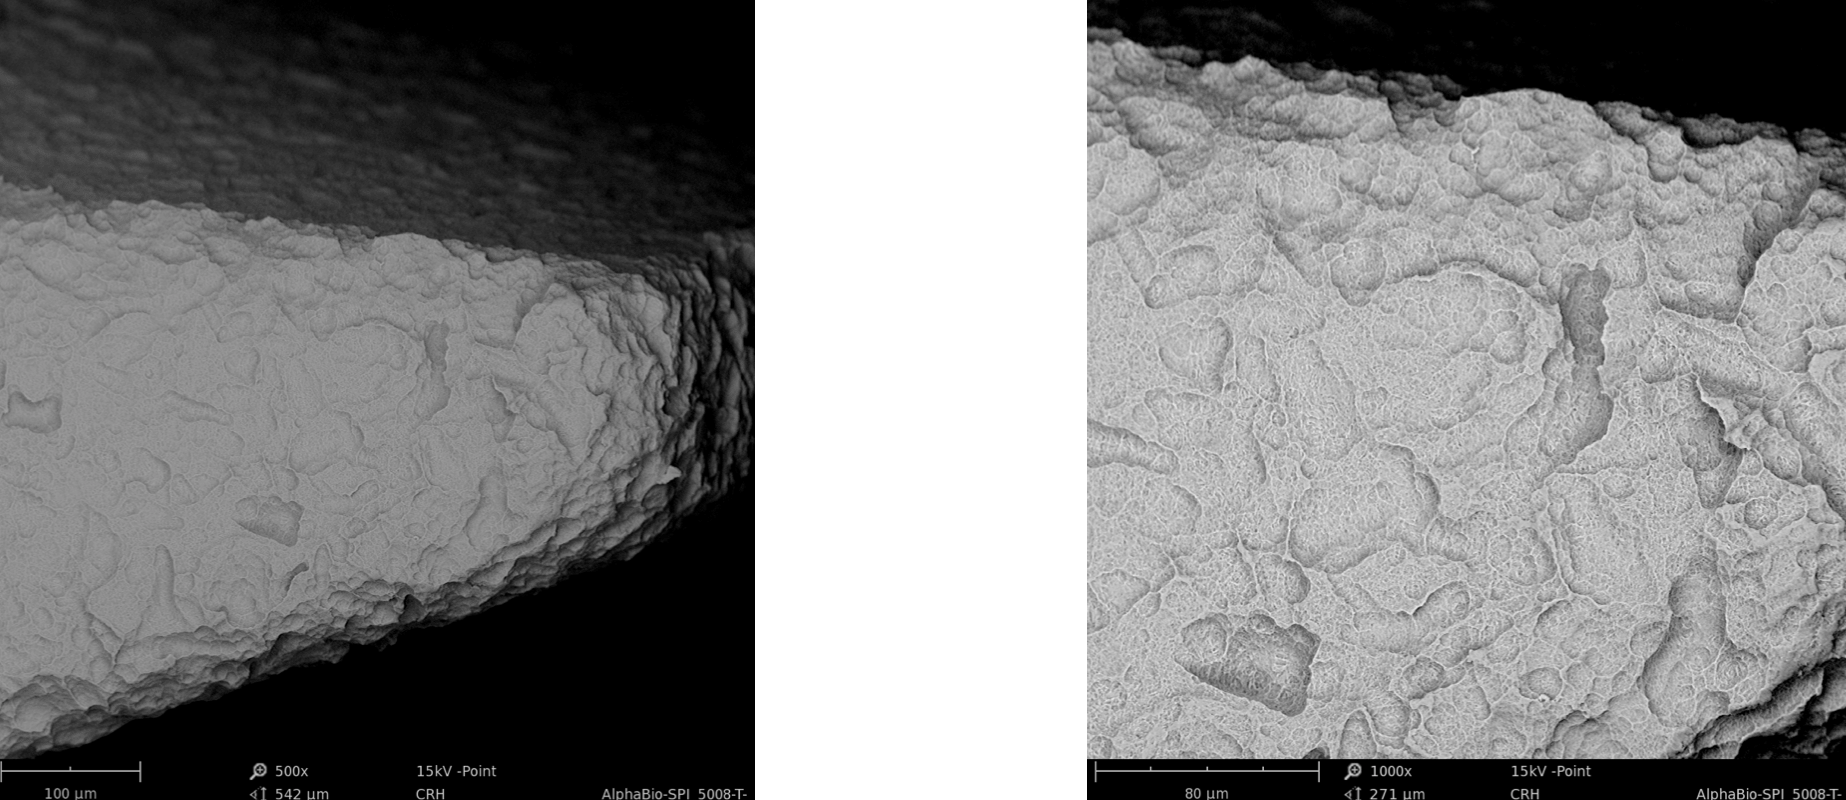
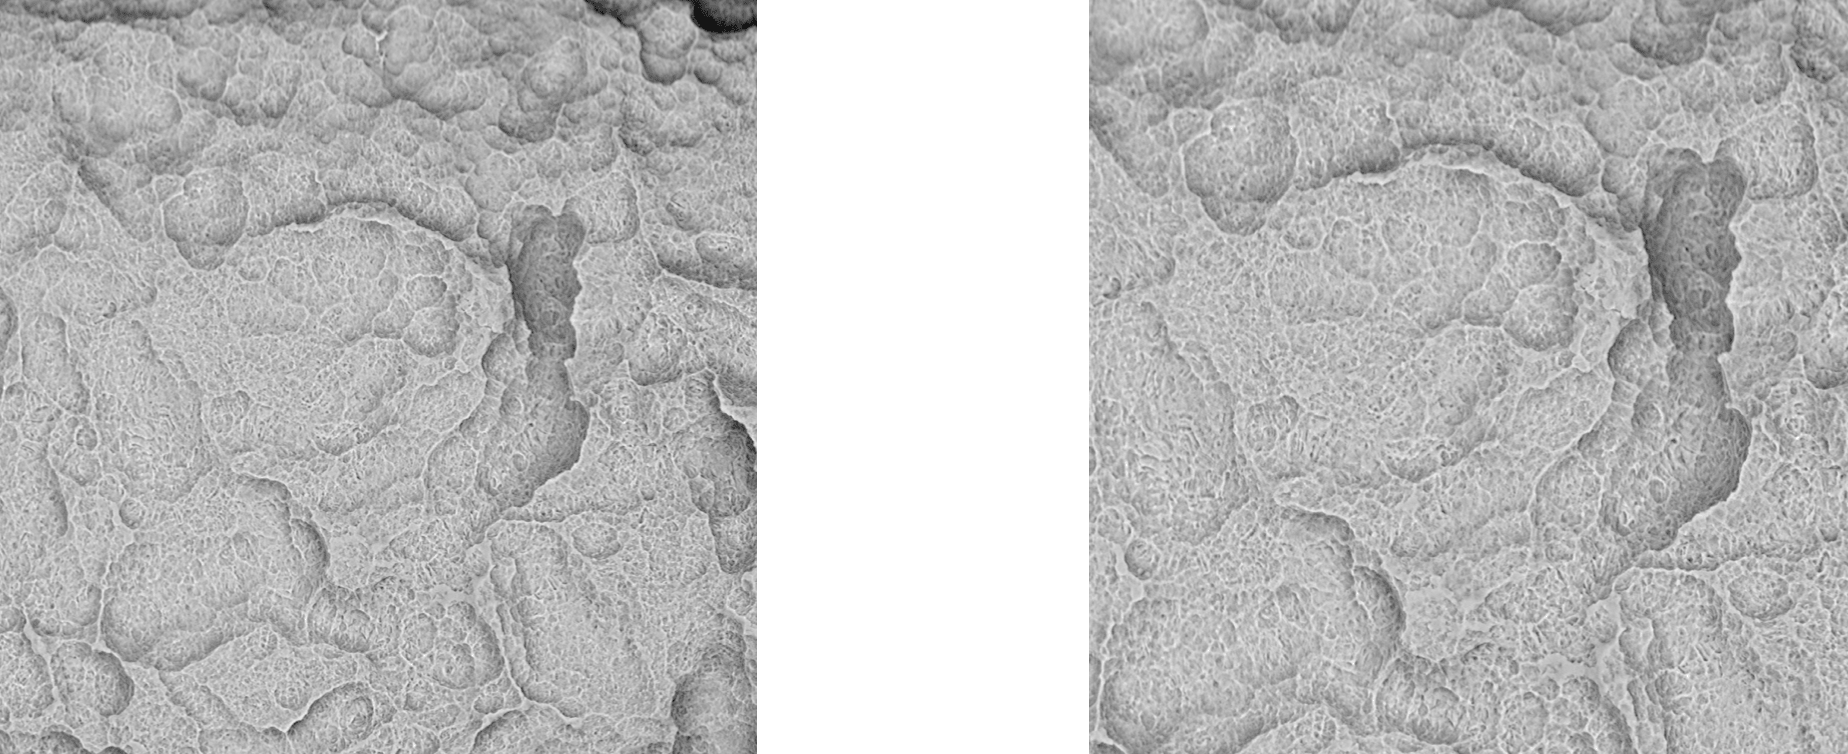
3.3 Surface-Topography - Material Contrast Images (Body)
Surface-Topography - Material Contrast Images (Body)
3.4 EDX Area Analysis
4 Synopsis
Name of Manufacturer:
Analyzed Product(s):
Title of Study:
Investigators:
Study centre:
Study carried out by:
Studied period:
Methodology:
Summary/Conclusions:
Alpha-Bio Tec Ltd.
SPI Spiral Implant LOT 14111986 Exp.Date:2019-10
Implant-Study 2014/2015Quantitative and qualitative element-analysis of implant- surfaces by SEM and EDX
Dr. Dirk U. Duddeck
Interdisciplinary Outpatient Dep. For Oral Surgery and Implantology, Dep. for Craniomaxillofacial and Plastic Surgery, University of Cologne
dedeMED - Medical Materials Research Institute Berlin
September 2014 – May 2015
Phenom proX Scanning Electron Microscope, equipped with high-sensitivity backscattered electron detector (compositional & topographical modes)EDX Analysis:Detector type: Silicon Drift Detector (SDD) Thermoelectrically cooled (LN2 free)Detector active Area: 25 mm2X-ray window: Ultra-thin Silicon Nitride (Si3N4) window allowing detection of elements C to AmEnergy resolution Mn Kα ≤ 140 eV Max. Input count rate: 300,000 cps
The implant “SPI Spiral Implant” provided by Alpha-Bio Tec for this analysis showed no significant traces of inorganic or organic residues and high mechanical precision.
5 Coordinating Investigator(s) Signature(s)
STUDY AUTHOR (S):
STUDY TITLE:
Dr. Dirk U. DuddeckInterdisciplinary Policlinic - Dep. for Oral Surgery and Implantology, Dep. for Craniomaxillofacial and Plastic Surgery, University of Cologne, Head: Prof. Dr. Dr. Joachim E. Zöller,Address: Kerpener Str. 62, D 50937 Köln, Germany,eMail: duddeck@dedemed.de
Implant-Study 2014/2015 Quantitative and qualitative element-analysis of implant-surfaces by SEM/EDX
I have read this report and confirm that to the best of my knowledge it accurately describes the conduct and results of the study.
DATE:
INVESTIGATOR:
May 18, 2015
Dr. Dirk U. Duddeck